
Local SEO reports
Local SEO Reports That Show Where You Rank on the Map
A table of positions tells a client very little. A map of their service area, coloured by where they rank, tells them everything at a glance. GridBeacon turns every scan into a PDF report, and on paid plans an AI-written report that explains what is happening and what to do about it.
No credit card required. Scan reports are free on every plan.
- Free scan report PDF
- AI report: 100 credits
- CSV exports
Report template
A Monthly Local SEO Report Template
Whatever tool you use, a local SEO report clients read has the same backbone. Use this order and keep each part short:
The headline
Two or three sentences: did map visibility go up or down, and why.
Visibility on the map
This month's heatmap next to last month's, with visibility, average rank and map pack share.
The competition
Who ranks above the business, where, and whether they gained or lost ground.
Work done and next steps
What you changed this month, and the two or three priorities for next month.
Report the same keywords with the same grid, centre and radius every month. Otherwise the heatmaps change because the settings changed, not the rankings.
Free on every plan
The Standard Scan Report
Every completed scan has a report you can open in the browser or download as a PDF. It presents the data without interpretation and uses no credits.
- Summary: keyword, scan date, grid setup, grid visibility, average rank, Google 3-pack share and best rank.
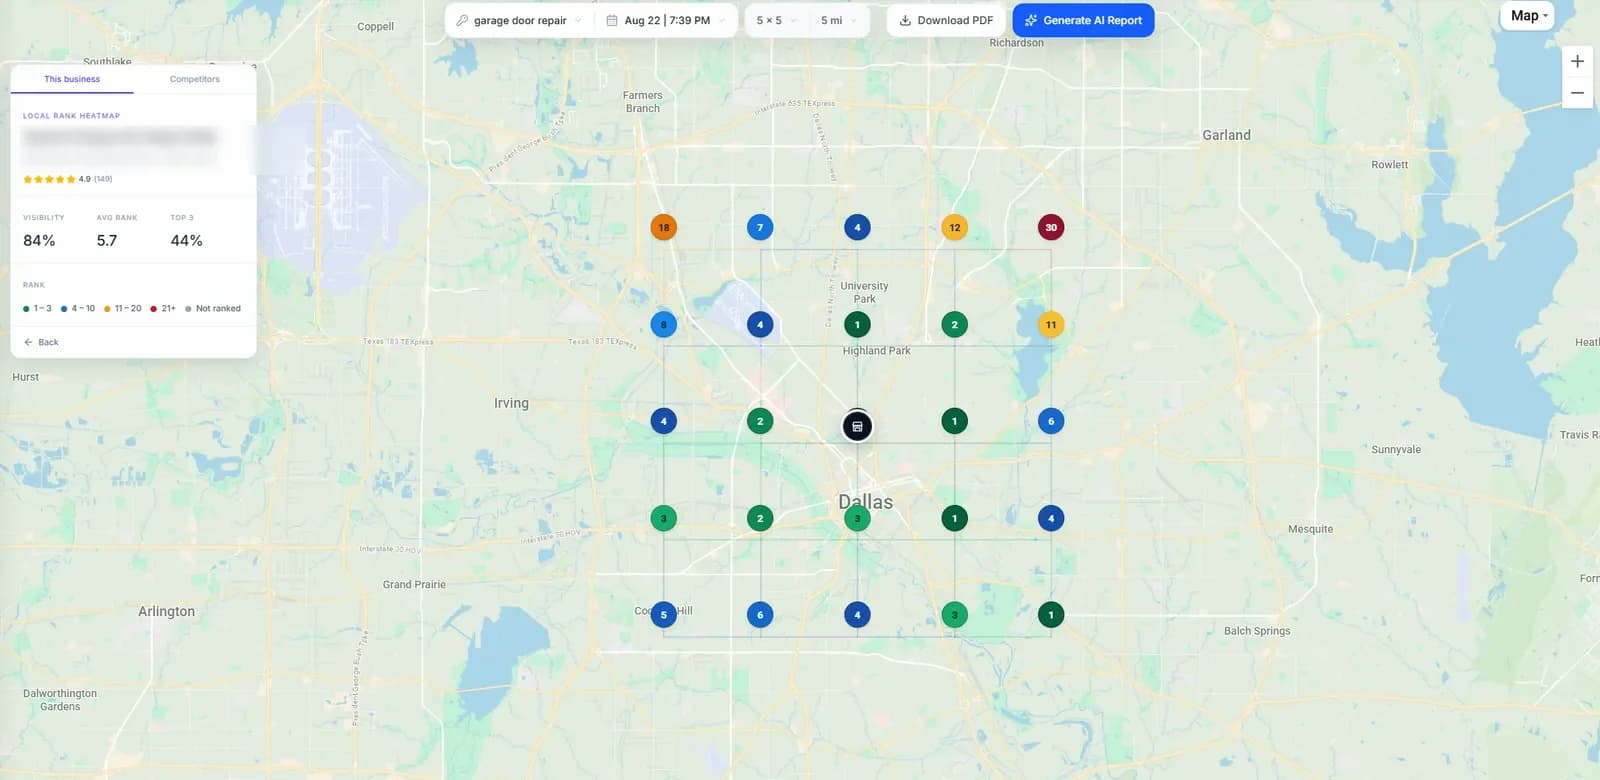
- Heatmap of the business's rank at every point.
- Rank tier distribution: how many points rank 1–3, 4–10, 11–20, 21+ or not at all.
- Proximity radius analysis: how rank changes with distance from the centre.
- Strongest and weakest grid zones.
- Competitor overlap: each competitor's average rank, top-3 points, appearances, points ahead of you, reviews and strongest zone.
Paid plans · 100 credits
The AI Ranking Intelligence Report
For clients who want to know what the grid means, not just what it shows. The AI report reads the scan data and writes a report around evidence from it.
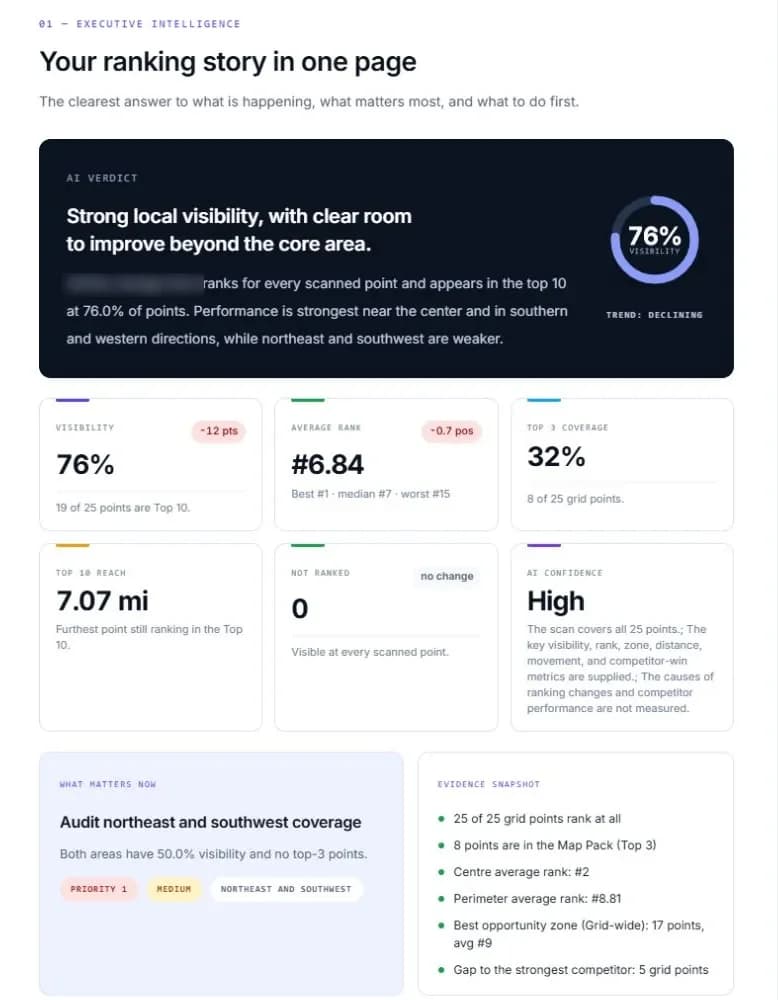
Your ranking story in one page
An executive summary a client can read in a minute.
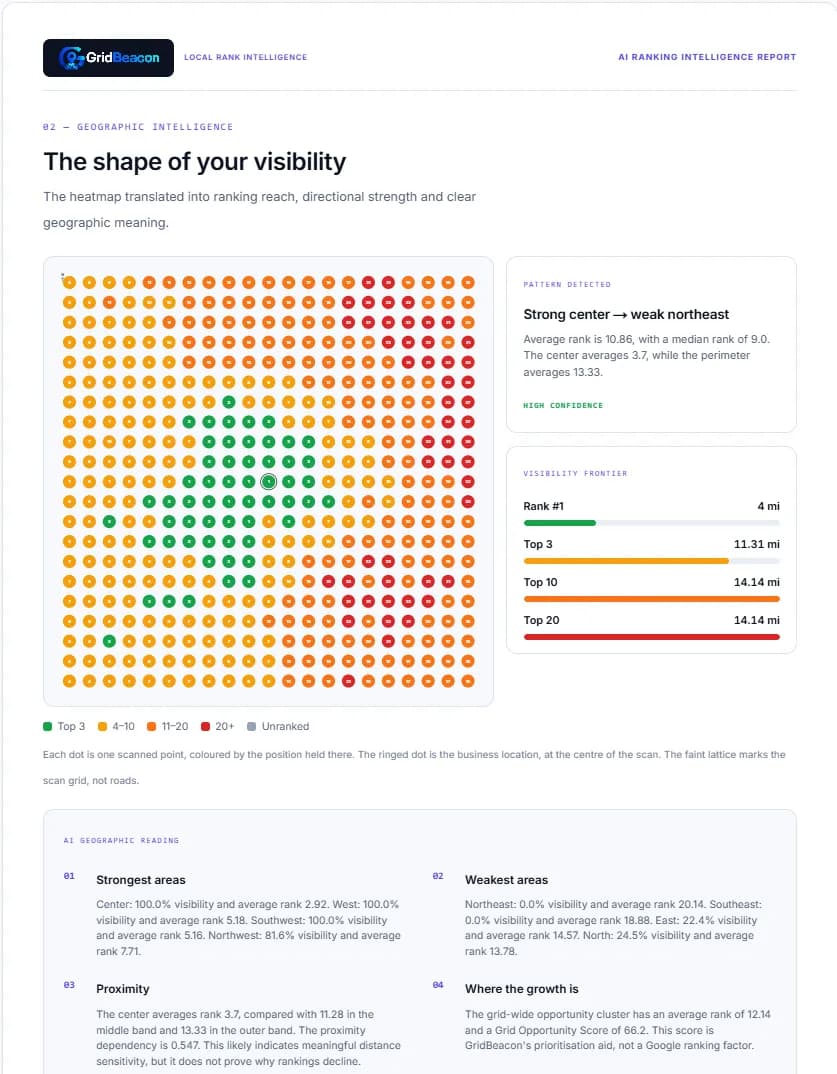
The shape of your visibility
Where the business is strong and weak across its area.
Who controls the local market?
The competitors that matter, and why the business is losing where it is.
Facts, causes and unknowns
Confirmed facts kept apart from likely causes and from what the data can't tell.
Prioritised actions with evidence
What to do next, in order, each tied to something in the scan.
Results and proof
Before, action, after: whether earlier work moved the rankings, plus a summary for the client.
Which one?
Scan Report vs AI Report
| Standard scan report | AI Ranking Intelligence report | |
|---|---|---|
| Cost | Free, no credits | 100 credits |
| Plans | Every plan | Paid plans |
| What it does | Presents the scan's data | Interprets the data and recommends actions |
| Best for | Your own analysis, data-minded clients | Client meetings, monthly summaries, owners |
| Format | Browser view and PDF | |
| Branding | GridBeacon | GridBeacon |
Workflow
A Local SEO Reporting Workflow That Runs Itself
Schedule the scans
Set each keyword to scan daily, weekly, biweekly or monthly. GridBeacon emails you when a scan is ready.
Check what moved
Trend arrows show which points rose or fell, and scan history lets you compare any two dates.
Pick the report
Download the free scan report, or generate an AI report when the client needs the story told.
Export the data
CSV exports of grid points and rank history feed your own spreadsheets or dashboards.
FAQ
Local SEO Report Questions
What should a local SEO report include?
A short summary of what changed, Google Maps visibility across the service area (ideally a geo-grid heatmap compared with last month), the competitors that rank above the business and where, the work done this month, and the plan for next month. Keep raw data in an appendix; lead with what it means.
How do I create a local SEO report in GridBeacon?
Run a scan, then open its report and download it as a PDF. That standard scan report is free and uses no credits. On paid plans you can also generate an AI Ranking Intelligence report for 100 credits, which explains the results in plain language and lists prioritised actions.
What is the difference between the scan report and the AI report?
The standard scan report presents the scan's data: the heatmap, visibility, average rank, strongest and weakest zones, rank by distance and a competitor table. The AI Ranking Intelligence report interprets it: why the business is winning or losing, confirmed facts versus likely causes, prioritised actions and a client-ready summary.
Are GridBeacon reports white-label?
No. Both reports carry GridBeacon's branding. You can send them to clients as they are, but not under your agency's own logo. If white-label reporting is essential, tools such as Local Falcon, BrightLocal and Local Viking offer it.
Can reports be sent to clients automatically?
Not yet. Scans can run on a schedule and GridBeacon emails you when each one is ready, but you download and send the report yourself.
Can I export the data behind a report?
Yes. You can export the grid points of a scan and your rank history as CSV files to use in your own spreadsheets or reporting tools.
Build Your First Local SEO Report
Scan a keyword on 500 free credits and download the report in minutes.
No credit card required.